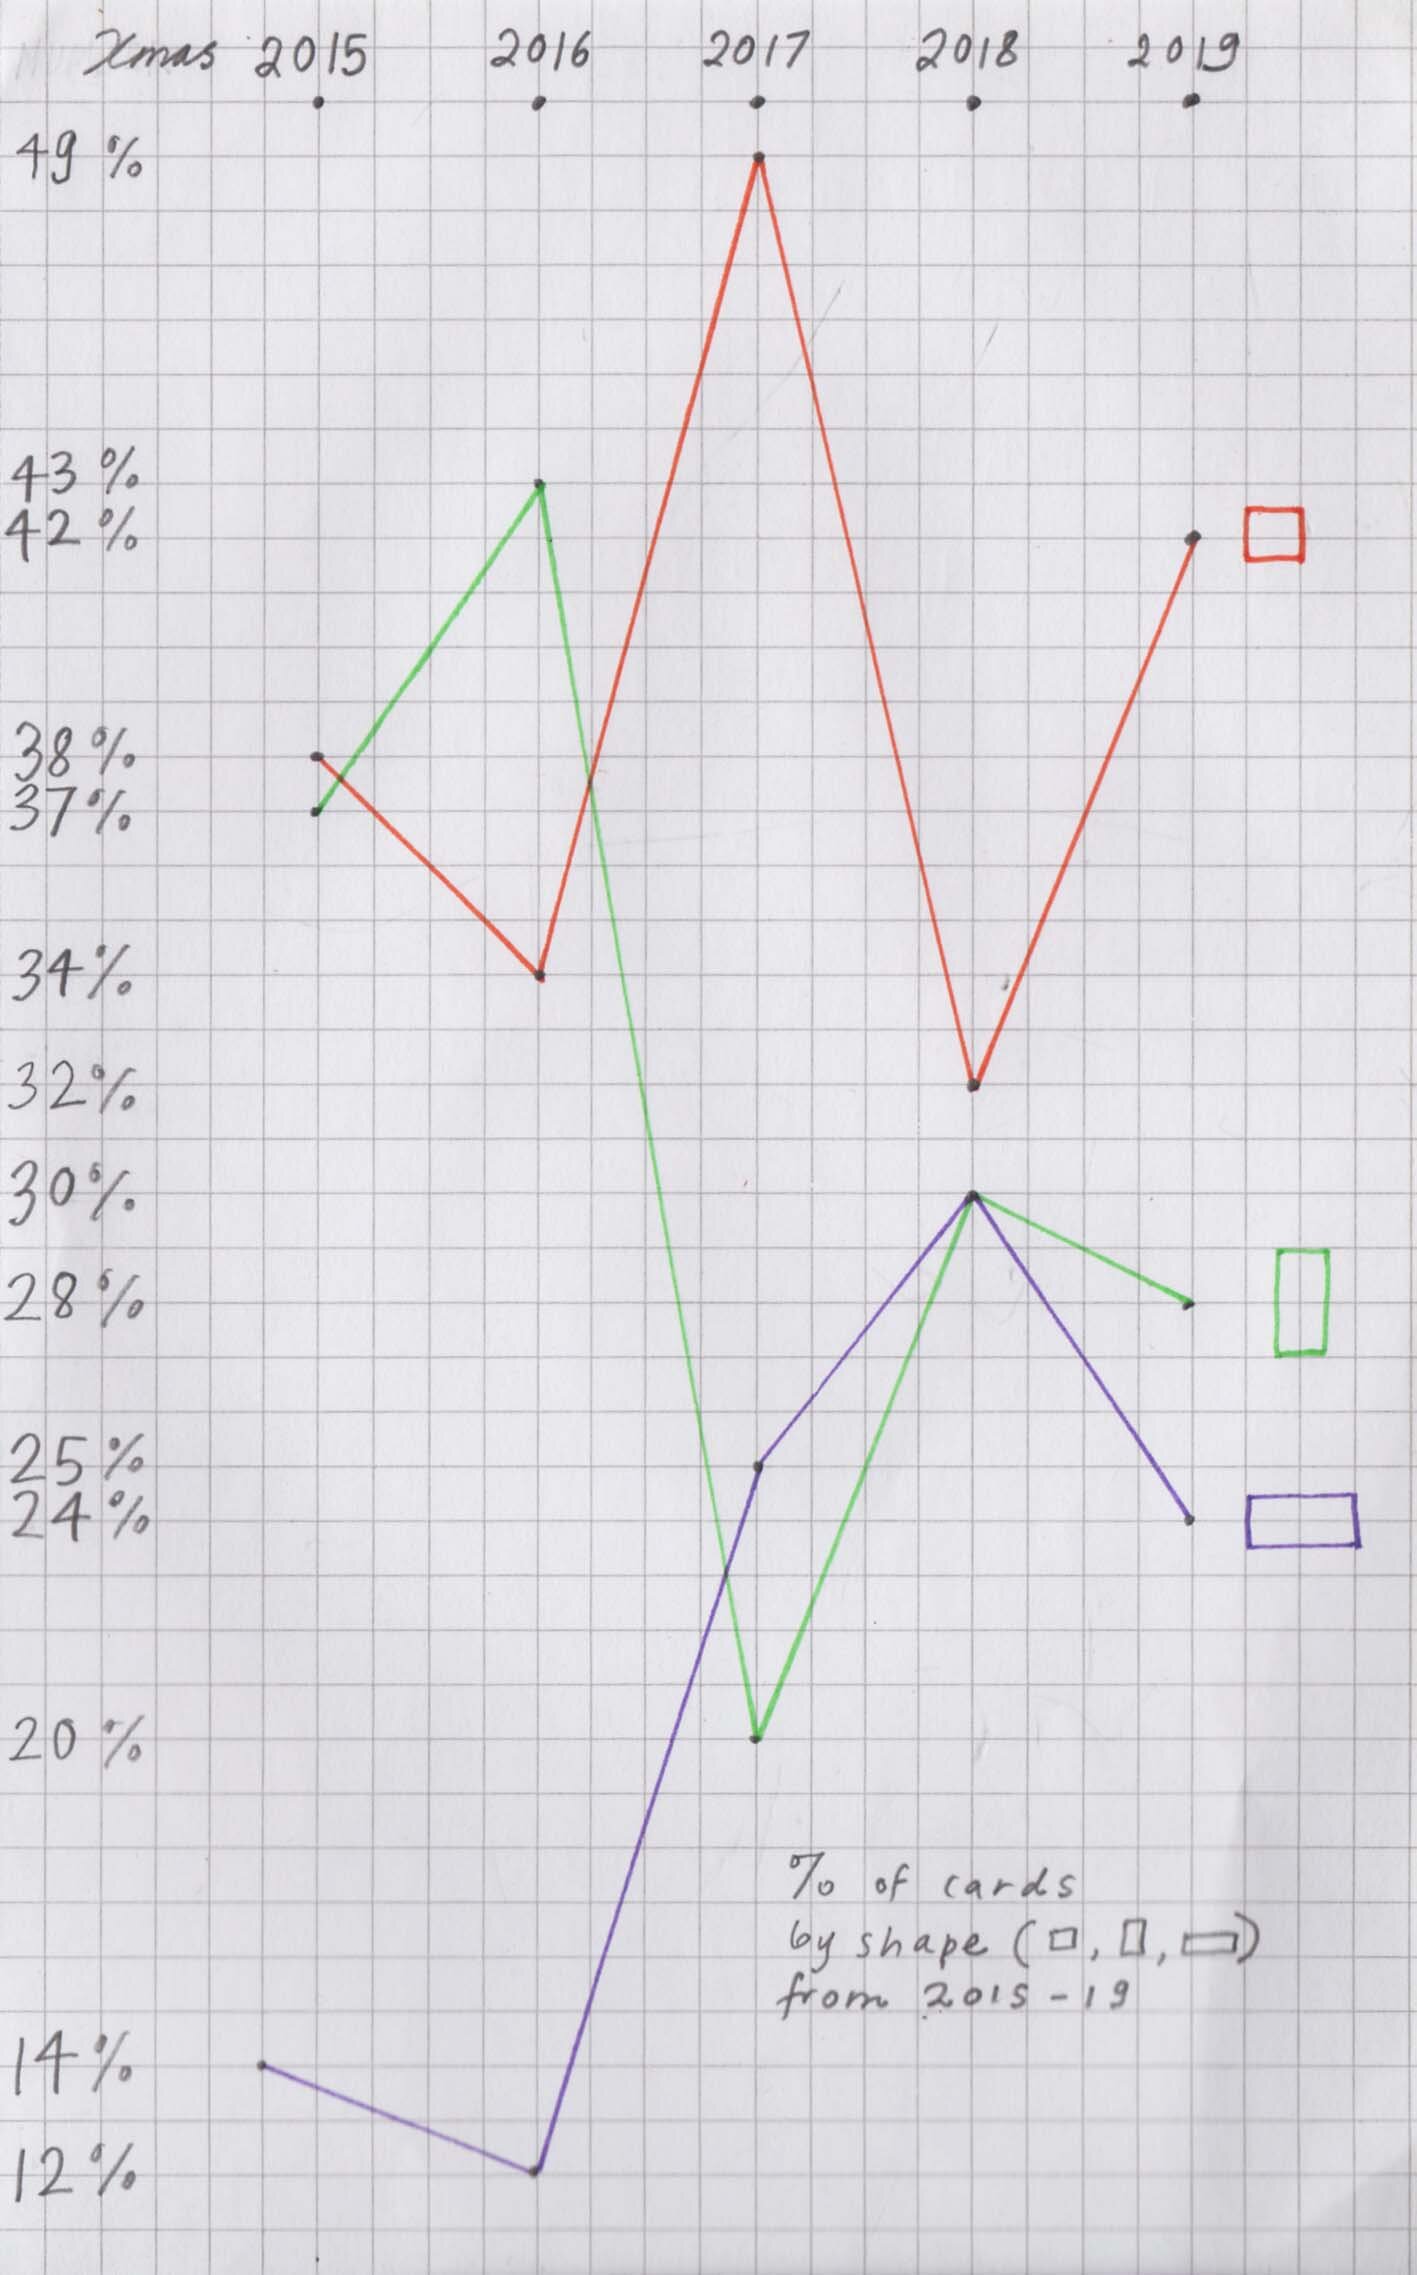
Last year’s christmas cards have gone in the bin, and my analysis done for the fifth year running. My best statistic is on the shape of the card - see graph below which shows the rise and fall of the three main shapes: square (usually the most popular), portrait (downward trend) and landscape (tussling for position with portrait over the past three years).
Homemade cards have almost drawn level with shop bought ones (49% to 51%), but here a new complication has emerged. People buy “homemade” cards in shops these days, so the category should really be “cards made by the people who sent them”, which is sometimes just a guess. Similarly, my subject categories have become blurred, with “winter scenes” accounting for 37% of the cards, animals and birds 20% and bible scenes only 10.5%. Still no stained glass cards!
Some of the best: top section genuine homemade, middle section ever popular birds, bottom section, three of the best.
This year I chose as my favourite card the christmas tree man shown below left and also in the homemade section above. Every previous year this cardmaker has sent an A4 sheet covered with interesting bits of printing which is difficult to display, so it was great to get it folded into a card - maybe we should have been doing this all along. We received two of the same card, a gaudy robin from Oxfam - this year’s most popular charity, with charity cards at a steady 26%. For comparison, last year’s statistics can be found here and the year before here.
Favourite cards: the winner, category straddler donkeys in the snow, and homemade card sent by somebody else


